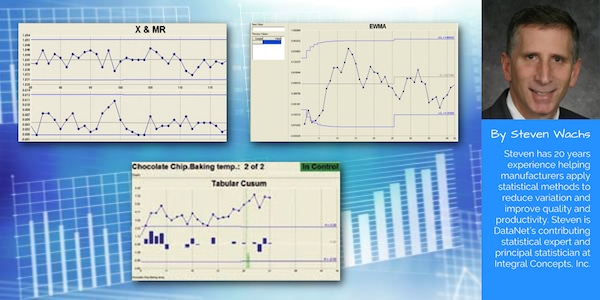
Proper control chart selection is critical to realizing the benefits of Statistical Process Control.
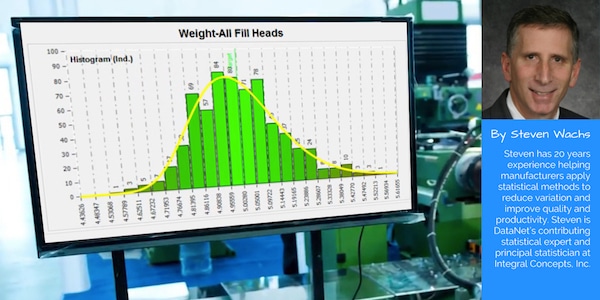
Before applying statistical methods that assume normality, it is necessary to perform a normality test on the data.
What is the difference between subgroup size, subrange size, and sample size in WinSPC? You will find the answer to that question in this article.
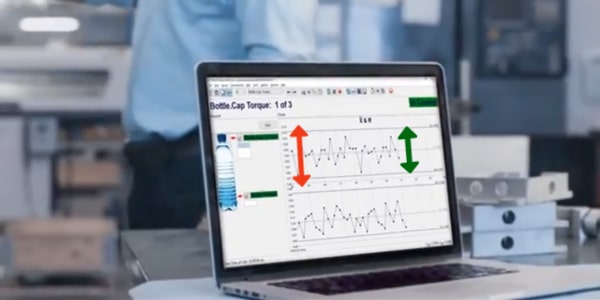
There is a balance between automation, and feedback. If you totally remove the operators away from the feedback of periodic measurements, they may be less aware of the nuances of the process over time.
When something goes wrong, we naturally react. If a product fails or a process performs inadequately, we attempt to discover what’s wrong so we can fix it.
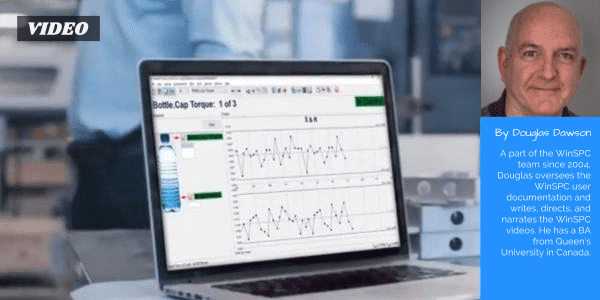
With a few clicks of the mouse, you can set up WinSPC to generate reports at scheduled intervals that meet key Quality needs.
This is a crucial distinction that is frequently confused. Basically, specification limits have to do with the voice of the customer while control limits have to do with the voice of the process.
There is a balance between automation, and feedback. If you totally remove the operators away from the feedback of periodic measurements, they may be less aware of the nuances of the process over time.
A large player in the fluid tank industry has installed WinSPC to prevent quality issues with preventative alerts on a critical aspect of the process.
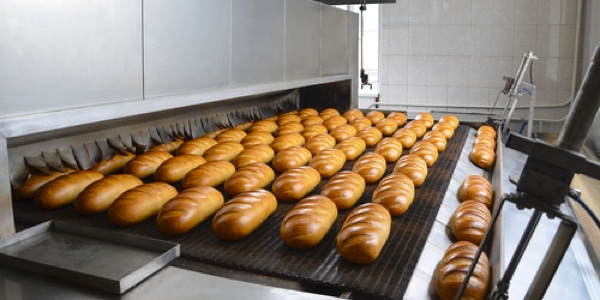
A bread company which has made public statements of intent to increase nutrition levels has installed WinSPC. The company uses the system to see charts that uncover interrelation between process factors.
SPC tells when to leave the process alone and when to react. By using SPC, companies can minimize the variation of their process by identifying, reacting to and eliminating extra sources of variation.
This is a crucial distinction that is frequently confused. Basically, specification limits have to do with the voice of the customer while control limits have to do with the voice of the process.
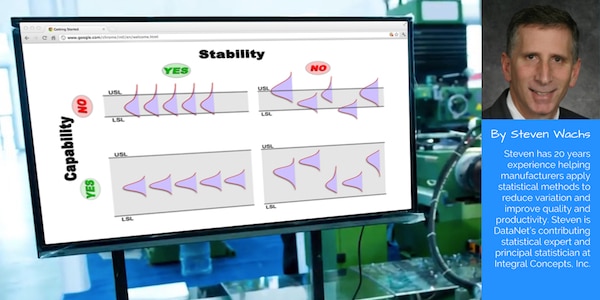
Nothing and everything. Though they are not directly linked, statistician and SPC expert Steven Wachs cautions that without evidence of process stability, capability data is useless.
Before applying statistical methods that assume normality, it is necessary to perform a normality test on the data.
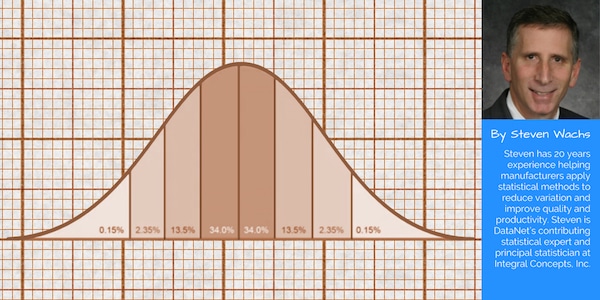
It’s not subjective: Because it’s an objective measure of variation, standard deviation is an essential statistical tool for increasing quality.
Proper control chart selection is critical to realizing the benefits of Statistical Process Control.
The key is to specify a subgroup size so that significant shifts are detected with high probability and that insignificant shifts are unlikely to produce a signal.
The subgroup size formula and application are discussed in the conclusion of this two-part topic.
Many believe that an out of control process produces defective parts. That’s not always true.
While the construction of control charts is relatively straightforward, often a more difficult question is: how do I know what process characteristics to control in the first place?
Highly effective SPC programs combine technical competencies, such as using the right chart and sample size for the application, with good management principles such as ensuring operator involvement.
When Statistical Process Control is applied properly, tremendous benefits in profitability and process understanding are achieved.
WinSPC offers intuitive Quality data entry and can capture independently from your CMMs, ERP and other sources.
What is SPC?

(/ stə-ˈti-sti-kəl ˈprä-ˌses kən-ˈtrōl /)noun — a statistical method that aids in detection of process problems
Statistical Process Control, commonly referred to as SPC, is a method for monitoring, controlling and, ideally, improving a process through statistical analysis.
The result of SPC is reduced scrap and rework costs, reduced process variation, and reduced material consumption.
SPC states that all processes exhibit intrinsic variation. However, sometimes processes exhibit excessive variation that produces undesirable or unpredictable results. SPC, in a manufacturing process optimization context, is used to reduce variation to achieve the best target value.
Considering SPC? The posters and slides available on our SPC Training Materials page contain practical information on SPC benefits and fundamentals.
In the mid-1920s, Dr. Walter A. Shewhart developed the fundamentals of Statistical Process Control (though that was not what it was called at the time) and the associated tool of the Control Chart. His reasoning and approach were practical, sensible and positive. In order to be so, he deliberately avoided overdoing mathematical detail. In later years, significant mathematical attributes were assigned to Shewhart’s thinking with the result that this work became better known than the pioneering application that he had worked up.
The crucial difference between Shewhart’s work and the inappropriately perceived purpose of SPC that emerged, that typically involved mathematical distortion and tampering, is that his developments were in context, and with the purpose, of process improvement, as opposed to mere process monitoring; that is, they could be described as helping to get the process into that “satisfactory state” which one might then be content to monitor. Note, however, that a true adherent to Deming’s principles would probably never reach that situation, following instead the philosophy and aim of continuous improvement.
Suppose that we are recording, regularly over time, some measurements from a process. The measurements might be lengths of steel rods after a cutting operation, or the lengths of time to service some machine, or your weight as measured on the bathroom scales each morning, or the percentage of defective (or non-conforming) items in batches from a supplier, or measurements of Intelligence Quotient, or times between sending out invoices and receiving the payment, etc., etc.
A series of line graphs or histograms can be drawn to represent the data as a statistical distribution. It is a picture of the behaviour of the variation in the measurement that is being recorded. If a process is deemed as “stable” then the concept is that it is in statistical control. The point is that, if an outside influence impacts upon the process, (e.g., a machine setting is altered or you go on a diet, etc.) then, in effect, the data are of course no longer all coming from the same source. It therefore follows that no single distribution could serve to represent them. If the distribution changes unpredictably over time, then the process is said to be out of control. As a scientist, Shewhart knew that there is always variation in anything that can be measured. The variation may be large, or it may be imperceptibly small, or it may be between these two extremes; but it is always there.
What inspired Shewhart’s development of the statistical control of processes was his observation that the variability which he saw in manufacturing processes often differed in behavior from that which he saw in so-called “natural” processes – by which he seems to have meant such phenomena as molecular motions.
Wheeler and Chambers combine and summarize these two important aspects as follows: “While every process displays variation, some processes display controlled variation, while others display uncontrolled variation.”
In particular, Shewhart often found controlled (stable) variation in natural processes and uncontrolled (unstable) variation in manufacturing processes. The difference is clear. In the former case, we know what to expect in terms of variability; in the latter we do not. We may predict the future, with some chance of success, in the former case; we cannot do so in the latter.
Shewhart gave us a technical tool to help identify the two types of variation: the control chart.
What is important is the understanding of why correct identification of the two types of variation is so vital. There are at least three prime reasons.
First, when there are irregular large deviations in output because of unexplained special causes, it is impossible to evaluate the effects of changes in design, training, purchasing policy, etc. which might be made to the system by management. The capability of a process is unknown, whilst the process is out of statistical control.
Second, when special causes have been eliminated, so that only common causes remain, improvement then has to depend upon management action. For such variation is due to the way that the processes and systems have been designed and built – and only management has authority and responsibility to work on systems and processes. As Myron Tribus, Director of the American Quality and Productivity Institute, has often said:
“The people work in a system. The job of the manager is to work on the system to improve it, continuously, with their help.”
Finally, something of great importance, but which has to be unknown to managers who do not have this understanding of variation, is that by (in effect) misinterpreting either type of cause as the other, and acting accordingly, they not only fail to improve matters – they literally make things worse.
These implications, and consequently the whole concept of the statistical control of processes, had a profound and lasting impact on Dr. Deming. Many aspects of his management philosophy emanate from considerations based on just these notions.
So why SPC?
The plain fact is that when a process is within statistical control, its output is indiscernible from random variation: the kind of variation which one gets from tossing coins, throwing dice, or shuffling cards. Whether or not the process is in control, the numbers will go up, the numbers will go down; indeed, occasionally we shall get a number that is the highest or the lowest for some time. Of course we shall: how could it be otherwise? The question is – do these individual occurrences mean anything important? When the process is out of control, the answer will sometimes be yes. When the process is in control, the answer is no.
So the main response to the question “Why SPC?” therefore this: It guides us to the type of action that is appropriate for trying to improve the functioning of a process. Should we react to individual results from the process (which is only sensible, if such a result is signaled by a control chart as being due to a special cause) or should we instead be going for change to the process itself, guided by cumulated evidence from its output (which is only sensible if the process is in control)?
The key to any process improvement program is the Plan-Do-Study-Act cycle described by Walter Shewhart.
Plan involves using SPC tools to help you identify problems and possible causes.
Do involves making changes to correct or improve the situation.
Study involves examining the effect of the changes (with the help of control charts).
Act involves, if the result is successful, standardizing the changes and then working on further improvements or, if the outcome is not successful, implementing other corrective actions.
by Roger Edgell with an excerpt from Statit Software, Inc.
What is SPC?

(/ stə-ˈti-sti-kəl ˈprä-ˌses kən-ˈtrōl /) noun — a statistical method that aids in detection of process problems
Statistical Process Control, commonly referred to as SPC, is a method for monitoring, controlling and, ideally, improving a process through statistical analysis.

The result of SPC is reduced scrap and rework costs, reduced process variation, and reduced material consumption.
SPC states that all processes exhibit intrinsic variation. However, sometimes processes exhibit excessive variation that produces undesirable or unpredictable results. SPC, in a manufacturing process optimization context, is used to reduce variation to achieve the best target value.
Considering SPC? The posters and slides available on our SPC Training Materials page contain practical information on SPC benefits and fundamentals.
In the mid-1920s, Dr. Walter A. Shewhart developed the fundamentals of Statistical Process Control (though that was not what it was called at the time) and the associated tool of the Control Chart. His reasoning and approach were practical, sensible and positive. In order to be so, he deliberately avoided overdoing mathematical detail. In later years, significant mathematical attributes were assigned to Shewhart’s thinking with the result that this work became better known than the pioneering application that he had worked up.
The crucial difference between Shewhart’s work and the inappropriately perceived purpose of SPC that emerged, that typically involved mathematical distortion and tampering, is that his developments were in context, and with the purpose, of process improvement, as opposed to mere process monitoring; that is, they could be described as helping to get the process into that “satisfactory state” which one might then be content to monitor. Note, however, that a true adherent to Deming’s principles would probably never reach that situation, following instead the philosophy and aim of continuous improvement.
Suppose that we are recording, regularly over time, some measurements from a process. The measurements might be lengths of steel rods after a cutting operation, or the lengths of time to service some machine, or your weight as measured on the bathroom scales each morning, or the percentage of defective (or non-conforming) items in batches from a supplier, or measurements of Intelligence Quotient, or times between sending out invoices and receiving the payment, etc., etc.
A series of line graphs or histograms can be drawn to represent the data as a statistical distribution. It is a picture of the behaviour of the variation in the measurement that is being recorded. If a process is deemed as “stable” then the concept is that it is in statistical control. The point is that, if an outside influence impacts upon the process, (e.g., a machine setting is altered or you go on a diet, etc.) then, in effect, the data are of course no longer all coming from the same source. It therefore follows that no single distribution could serve to represent them. If the distribution changes unpredictably over time, then the process is said to be out of control. As a scientist, Shewhart knew that there is always variation in anything that can be measured. The variation may be large, or it may be imperceptibly small, or it may be between these two extremes; but it is always there.
What inspired Shewhart’s development of the statistical control of processes was his observation that the variability which he saw in manufacturing processes often differed in behavior from that which he saw in so-called “natural” processes – by which he seems to have meant such phenomena as molecular motions.
Wheeler and Chambers combine and summarize these two important aspects as follows: “While every process displays variation, some processes display controlled variation, while others display uncontrolled variation.”
In particular, Shewhart often found controlled (stable) variation in natural processes and uncontrolled (unstable) variation in manufacturing processes. The difference is clear. In the former case, we know what to expect in terms of variability; in the latter we do not. We may predict the future, with some chance of success, in the former case; we cannot do so in the latter.
Shewhart gave us a technical tool to help identify the two types of variation: the control chart.
What is important is the understanding of why correct identification of the two types of variation is so vital. There are at least three prime reasons.
First, when there are irregular large deviations in output because of unexplained special causes, it is impossible to evaluate the effects of changes in design, training, purchasing policy, etc. which might be made to the system by management. The capability of a process is unknown, whilst the process is out of statistical control.
Second, when special causes have been eliminated, so that only common causes remain, improvement then has to depend upon management action. For such variation is due to the way that the processes and systems have been designed and built – and only management has authority and responsibility to work on systems and processes. As Myron Tribus, Director of the American Quality and Productivity Institute, has often said:
“The people work in a system. The job of the manager is to work on the system to improve it, continuously, with their help.”
Finally, something of great importance, but which has to be unknown to managers who do not have this understanding of variation, is that by (in effect) misinterpreting either type of cause as the other, and acting accordingly, they not only fail to improve matters – they literally make things worse.
These implications, and consequently the whole concept of the statistical control of processes, had a profound and lasting impact on Dr. Deming. Many aspects of his management philosophy emanate from considerations based on just these notions.
So why SPC?
The plain fact is that when a process is within statistical control, its output is indiscernible from random variation: the kind of variation which one gets from tossing coins, throwing dice, or shuffling cards. Whether or not the process is in control, the numbers will go up, the numbers will go down; indeed, occasionally we shall get a number that is the highest or the lowest for some time. Of course we shall: how could it be otherwise? The question is – do these individual occurrences mean anything important? When the process is out of control, the answer will sometimes be yes. When the process is in control, the answer is no.
So the main response to the question “Why SPC?” therefore this: It guides us to the type of action that is appropriate for trying to improve the functioning of a process. Should we react to individual results from the process (which is only sensible, if such a result is signaled by a control chart as being due to a special cause) or should we instead be going for change to the process itself, guided by cumulated evidence from its output (which is only sensible if the process is in control)?
The key to any process improvement program is the Plan-Do-Study-Act cycle described by Walter Shewhart.
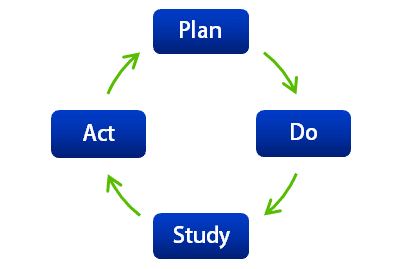
Plan involves using SPC tools to help you identify problems and possible causes.
Do involves making changes to correct or improve the situation.
Study involves examining the effect of the changes (with the help of control charts).
Act involves, if the result is successful, standardizing the changes and then working on further improvements or, if the outcome is not successful, implementing other corrective actions.
by Roger Edgell with an excerpt from Statit Software, Inc.
By systematically detecting (and rectifying) sources of special cause variation upstream in the process, the important process outcomes become predictable.
More companies are leveraging high speed vision systems to inspect multiple quality characteristics on their products.
In order to maximize profitability while complying with government regulations regarding net package contents, food manufacturers and packagers must achieve an optimal balance.
While enormous dollars are spent reacting to problems, Quality teams can excel to new heights by focusing on prevention: of product failures, of scrap, and of other inefficiencies.
An approach to deploying control charts with short production runs is to utilize charts of common characteristics across different products.
Characteristics with larger nominal values tend to have more variation than characteristics with smaller nominal values.
Looking just at the auto industry, GM has recalled roughly 3 million vehicles this year in the U.S. alone. In 2009, GM recalled roughly 2.2 million vehicles.
Unfortunately, applying “simple” tools at the expense of tools with considerably more value (and really not much more complexity or difficulty) doesn’t cut it.
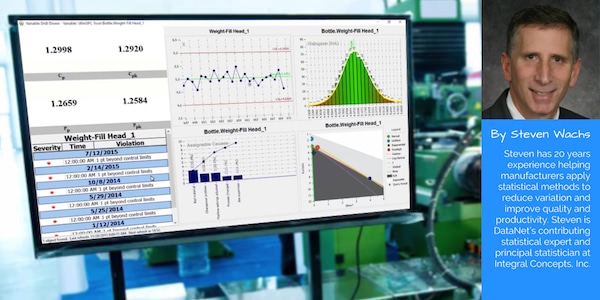
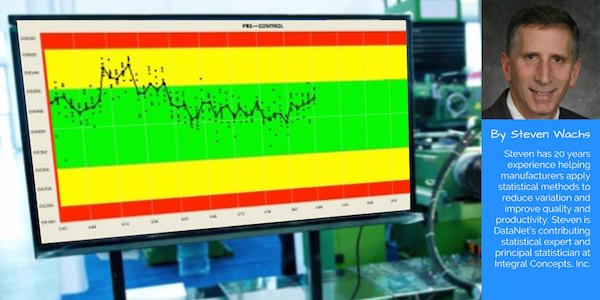
The purpose of control charting is to regularly monitor a process so that significant process changes may be detected.
Many manufacturing leaders believe that their production personnel use SPC properly, but the evidence suggests otherwise.
Yes, you can chart deviation-from-target. You do this by creating a Target chart, a chart that plots the deviation of subgroup values from a target value.
As the bumper sticker says, “Shifts Happen” and so we generally want to use the slightly more liberal process capability of Cpk ≥ 1.33.
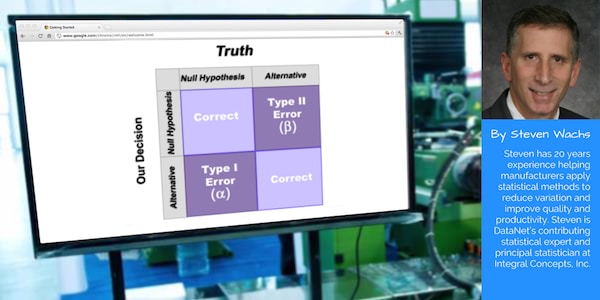
This article will review statistical hypothesis testing in general and then introduce equivalence testing and its application.
“Lean Manufacturing” (a.k.a. the Toyota Production System) is a toolbox of techniques to improve operational efficiency and eliminate waste.
Last month I began to answer this question by examining some of the 14 Principles of Lean Manufacturing according to Jeffery Liker. Let’s continue that examination.
Process Control is proactive rather than reactive. The key elements of process control are outlined in this article.
