SPC FAQ

Just getting started? Here are answers to some of the most common SPC questions asked by those who have heard about SPC and want to learn more.
What is Statistical Process Control?
Statistical Process Control, commonly referred to as SPC, is a method for monitoring, controlling, and improving a process through statistical analysis. The philosophy states that all processes exhibit natural variation, or randomness. However, sometimes processes exhibit excessive variation that produces undesirable or unpredictable results. In a manufacturing context, the less consistent and predictable a process is, the higher its costs are. SPC is used to reduce variation and lower costs.
What is real-time SPC?
Today’s manufacturers rely heavily on a combination of automation, machinery, devices and technology in an effort to produce products faster. As manufacturing capacity increases, manufacturers require a method to increase their quality control capacity while shrinking the organization’s overall cost-of-quality. Traditional SPC allows manufacturers to understand what products and processes were in-control or out-of-control. However, for some manufacturers this information comes too little, too late.
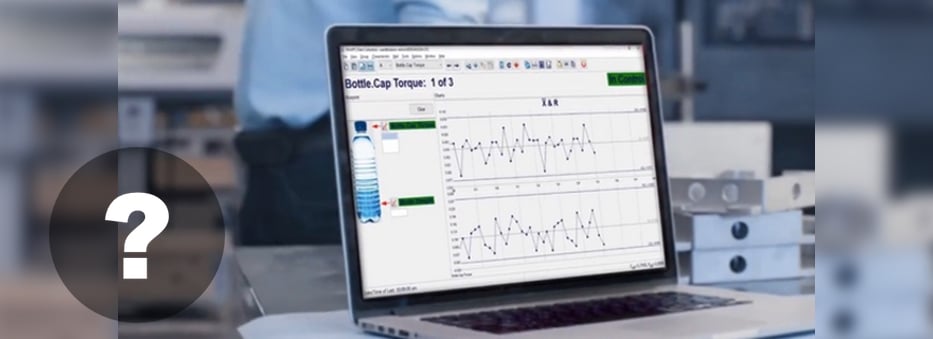
Real-time or in-line SPC is defined as the technique of applying SPC on the shop floor at the time of production. Real-time SPC gathers product and process information in real-time and provides operators and plant managers with alerts, triggers, and other event management tools to quickly contain and fix defects before they leave the shop floor.
Most continuous improvement, Six Sigma and lean manufacturing initiatives require some form of SPC. While some programs focus on quality assurance, others focus on process optimization. Both real-time SPC and SPC are viable programs for improving manufacturing product and process quality. However, real-time SPC offers manufacturers a method to concurrently improve product and process quality and lower the cost-of-quality. Similar to the benefits that a calculator offers the mathematician, automated, real-time SPC provides manufacturers with a leaner method to continuously improve their product and process quality.
Where did SPC originate?
The foundation for Statistical Process Control was laid by Dr. Walter Shewhart working in the Bell Telephone Laboratories in the 1920s conducting research on methods to improve quality and lower costs. He developed the concept of control with regard to variation, and came up with Statistical Process Control charts which provide a simple way to determine if the process is in control or not. Dr. W. Edwards Deming built upon Shewhart’s work and took the concepts to Japan following WWII. There, Japanese industry adopted the concepts whole-heartedly. The resulting high quality of Japanese products is world-renowned. Dr. Deming is famous throughout Japan. Today, SPC is used in manufacturing facilities around the world.
What is a histogram?
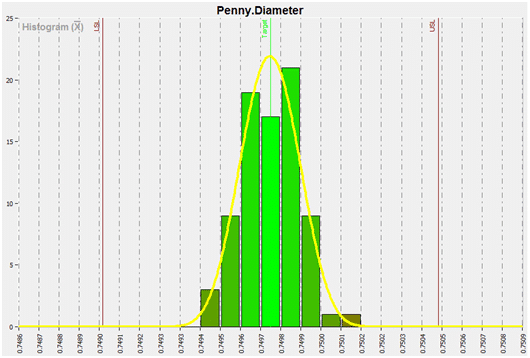
A histogram is a bar graph. Each bar shows the number of data points that fall within its measurement range. The relative heights of the bars offer clues to the health of a process.
What are control charts?
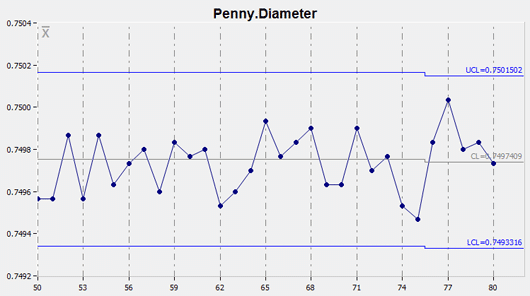
Control charts consist of product or process measurements over time and are a graphical representation of the variation between those measurements (or between subgroups of those measurements). Some additional horizontal lines representing the average measurement and control limits are frequently drawn across a control chart. Also, notes about data points and limit violations are commonly displayed.
Control charts have four key features: 1. Data points are either averages of subgroup measurements or individual measurements plotted on the x/y axis and joined by a line. Time is always on the x-axis. 2. The Average or Center Line is the average or mean of the data points and is drawn across the middle section of the graph, usually as a heavy or solid line. 3. The Upper Control Limit (UCL) is drawn above the centerline and often annotated as “UCL”. This is sometimes called the “+3 sigma” line. 4. The Lower Control Limit (LCL) is drawn below the centerline and often annotated as “LCL”. This is sometimes called the “-3 sigma” line.
What is the purpose of a control chart?
It helps quality teams monitor how a process is performing and identify special or assignable causes for factors that impede peak performance.
How do they work?
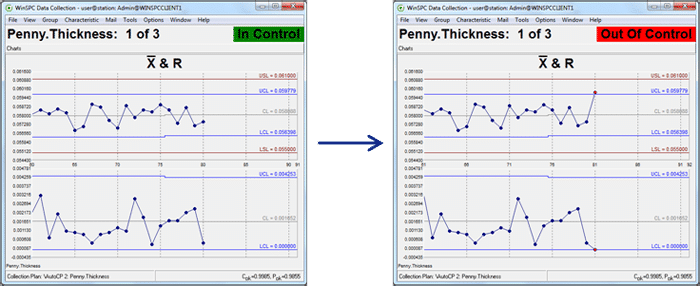
Control charts show if a process is in control or out of control. They show the variance (or variation) of process output over time. Control charts compare this variance against upper and lower limits to see if it fits within the expected, specific, predictable and normal variation levels. If so, the process is considered in control and the variance between measurements is considered normal random variation that is inherent in the process. If, however, the variance falls outside the limits, or has a run of non-natural points, the process is considered out of control.
What’s this relationship between variation and assignable causes?
Variation is the key to statistical process control charts. The extent of variation in a process indicates whether a process is working as it should. When the variation between the points is large enough for the process to be out of control, the variation is determined to be due to non-natural or assignable (special) causes.
So how are these normal, predictable, variance levels determined?
The process itself determines the control limits. The control limits are automatically calculated from the data produced by the process. Control limits are the “voice of the process”. They are not specifications, corporate goals, or the “voice of the customer”. These two concepts must never be confused.
What about rule violations for determining if a series of points within the control limits is unnatural?
The work done by Shewart and his colleagues gave them a base of empirical knowledge on which to base rule violations. An example of a rule violation is six points in a row steadily increasing or decreasing. Rules such as this have been codified and are contained in the AT&T Statistical Quality Control Handbook. SPC software can be used to automatically check for violations of these time-tested and industry proven rules.
What’s the significance of in-control and out-of-control?
If a process is in-control, the outcomes of the process can be accurately predicted. In an out-of-control process, there is no way of predicting whether the results will meet the target. An out-of-control process is like driving a bus with brakes that may or may not work. If a process is out-of-control, you look for the assignable causes that make it so and attempt to eliminate them.
What does process capability mean?
Process capability simply refers to what a process is capable of producing. Some processes might be capable of producing 100% of their output within spec, others considerably less. Sometimes an organization’s requirements, specifications, or goals are beyond what the process is actually capable of producing. In this case, either the process must be made more capable or the requirements, specifications, or goals relaxed.
Can any type of process data be judged using control charts?
Processes which produce data that exhibits natural or common-cause variation will form a distribution that looks like a bell-curve. For these types of processes, control charts will provide useful information. If the data is not normally distributed, does not form a bell-curve, the process is already out-of-control so it is not predictable. In this case we must look for ways to bring the process into control. For example, the data may be too broad, using measurements from different work shifts that have different process outcomes. Organizing the data collection into rational subgroups, each of which could be in control, is the first step to using control charts.
How do I make a control chart?
In the past, creating control charts was a difficult process requiring statisticians and mathematicians to remember the formulas and actually calculate the various data points and control limits. Today, using SPC software and computers, control charts can be constructed quickly and accurately, freeing you to investigate and remedy the situations exposed by control charts.
When is the best time to start SPC?
Now! The key to SPC is action. Rather than trying to discover the perfect methodology or waiting until you are an SPC expert, it is best to dive in and get started. You can always make adjustments as you go along. In most circumstances, the cost of poor quality and non-conformance is too great to do otherwise.
What are the Western Electric Rules that determine whether or not a process is in-control?
The relevant Western Electric Rules and the charts to which they apply are detailed in the below table.
| CHARTS | Western Electric Rules |
|
|
|
|
|
|
|
|
by Statit Software, Inc.


