Let’s take the confusion out of Cpk and Ppk.
Analysis and Reporting

Analysis and reporting are critical activities for Quality teams. With WinSPC’s suite of analysis tools, you can probe the depths of process and product data, mine it for answers to why things are the way they are, reinforce strengths, and remedy weaknesses. With WinSPC’s reports, you can serve a seemingly endless list of purposes: nurture supplier-customer relationships, fill internal knowledge gaps that create waste, connect executive planning to shop-floor realities, and satisfy the documentation burden from regulatory agencies.
Analyzing with WinSPC
Analyzing with WinSPC often begins with searching or filtering your WinSPC database. You specify criteria, WinSPC isolates the data that matches that criteria, and you’re on your way to answering such questions as:
- What quality problems did we have recently?
- What are our potential sources of variation?
- And what process inputs are affecting our final product quality?
WinSPC’s searching and filtering tool is easy-to-use for everyone. You don’t have to be a programmer and you don’t have to be a statistics black belt. And your criteria can be just about anything you can think of: shift, lot number, violations, statistics, dates, corrective actions, assignable causes, and more.
To jumpstart your analysis, WinSPC comes with dozens of pre-built searches, searches concerning trouble spots common to most manufacturers. As a result, almost in the blink of an eye, without entering criteria yourself, you can get a list of processes that, for example:
- Are statistically incapable
- Required a corrective action the previous week
- Had significant give-away
- Had a spec limit or control limit violation within the last four hours
- Or met other important conditions
Once you’ve identified a narrowed set of data to further investigate, with a single-click you can drill down and expose an exhaustive set of details about it, all efficiently organized in one location.
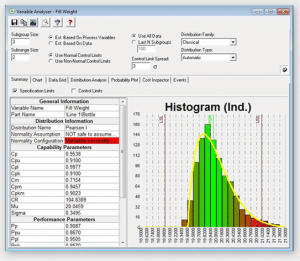
 There, you can sort the data by line number, user, machine, or other groupings. You can examine its capability and performance parameters, distribution details, goodness of fit, and sensitivity. You can view the data in every industry-standard chart there is. You can even run it through WinSPC’s patented Cost Inspector, a breakthrough engine that uncovers hidden costs and quantifies potential savings opportunities related to both process variation and process offset.
Read the Cost Inspector White Paper
WinSPC’s suite of analysis tools simplify the application of statistical theory to manufacturing data and, in doing so, enable Quality teams to act both effectively and with confidence. For more information, watch the Monitoring and Analyzing with Dashboards video.
See how WinSPC performs statistical analysis.
Reporting with WinSPC
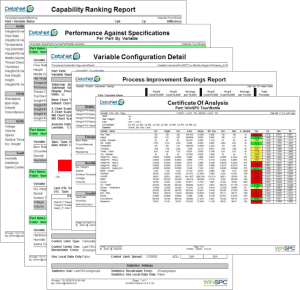
Understanding WinSPC reporting begins with ready-to-use reports. There are over ninety of them that ship with WinSPC, all professionally formatted. Most popular among these are:
- The Capability Study report
- The Performance Against Specifications report
- The Variable Detail report
- The Process Improvement Savings report
- And the Certificate of Analysis report
 These and the other ready-to-use reports anticipate common reporting needs so effectively, they can save Quality teams hundreds of hours on their own.
Running a report takes just a few mouseclicks: you right-click whatever item contains the data you want reported on and, from a shortcut menu, select a report. There are several items that contain data you might want reported on: part folders, parts, variables, attributes, collection plan folders, collection plans, data sets, and archives. Whichever you choose, all the relevant data within that item gets accounted for in the report.
You can run reports in both PDF and HTML formats, or you can view the report directly in WinSPC’s Report Preview window.
For added convenience, once a report has been generated, in one mouseclick, you can launch your e-mail client and have a PDF version of your report already attached to a blank e-mail, ready for you to address and send on its way.
 To personalize a ready-to-use report or to create an entirely new report, WinSPC has a built-in report designer. This designer is extremely capable and has been used to produce some stunningly unique reports. And it is visual, so you don’t need to be overly technical to use it (though it does support scripting if you’re inclined to employ that).
The rich, graphical nature of WinSPC’s reports allow the vital information in your WinSPC database to be understood from all angles, enabling viewers of those reports to translate that information into actionable intelligence and guide both short- and long-term strategies. For more information, watch the Generating Reports video.
On a tight budget? This white paper contains information about optimizing resource use to achieve Six Sigma benefits on a small budget.

